Free Access
Fig. 7
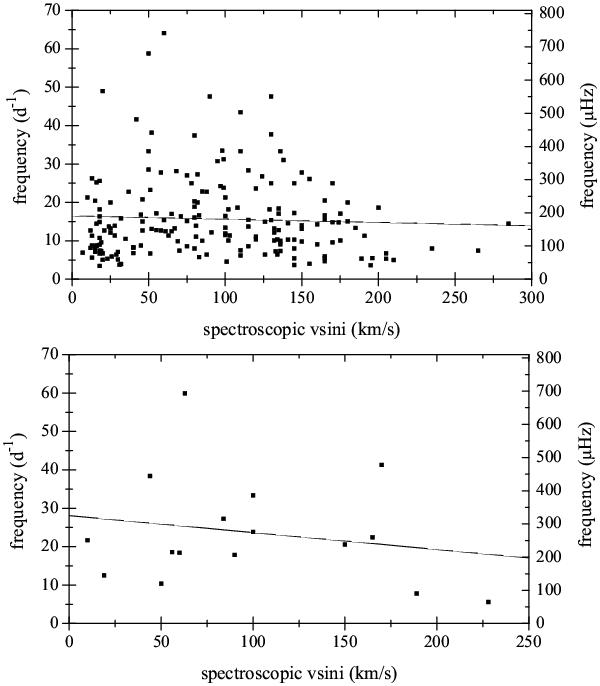
Frequency of the dominant mode as a function of vsini for δ Sct stars from the catalogues of Rodríguez et al. (2000, top and Uytterhoeven et al. (2011, bottom. The solid line represents a linear function fit to the shown data points. Detailed information on individual stars is provided in Table A.1.
This figure is made of several images, please see below:
Current usage metrics show cumulative count of Article Views (full-text article views including HTML views, PDF and ePub downloads, according to the available data) and Abstracts Views on Vision4Press platform.
Data correspond to usage on the plateform after 2015. The current usage metrics is available 48-96 hours after online publication and is updated daily on week days.
Initial download of the metrics may take a while.