Fig. 5
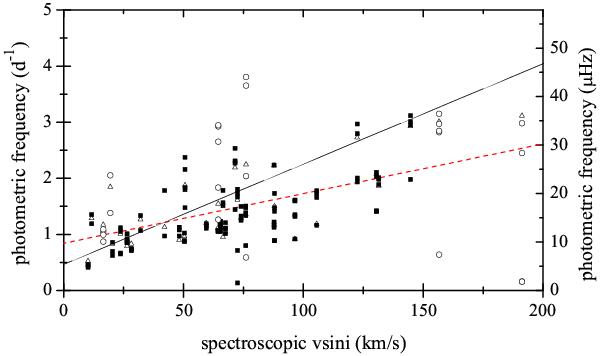
vsini versus independent frequencies for the sample stars. Open triangles refer to the dominant oscillation mode for each star; the two other symbols represent all other independent frequencies. Filled boxes and open circles refer to γ Dor and hybrid pulsators, respectively. The solid black line shows linear fit to all data points (there are three frequencies between 18 (208.26) and 21 (242.97) d-1 (μHz) in the δ Sct domain); the red dashed line represents a linear fit to the frequencies in the γ Dor range after removing the δ Sct frequencies.
Current usage metrics show cumulative count of Article Views (full-text article views including HTML views, PDF and ePub downloads, according to the available data) and Abstracts Views on Vision4Press platform.
Data correspond to usage on the plateform after 2015. The current usage metrics is available 48-96 hours after online publication and is updated daily on week days.
Initial download of the metrics may take a while.