Free Access
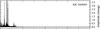
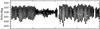
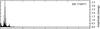
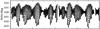
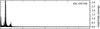
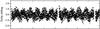
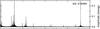
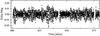
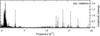
Fig. 2
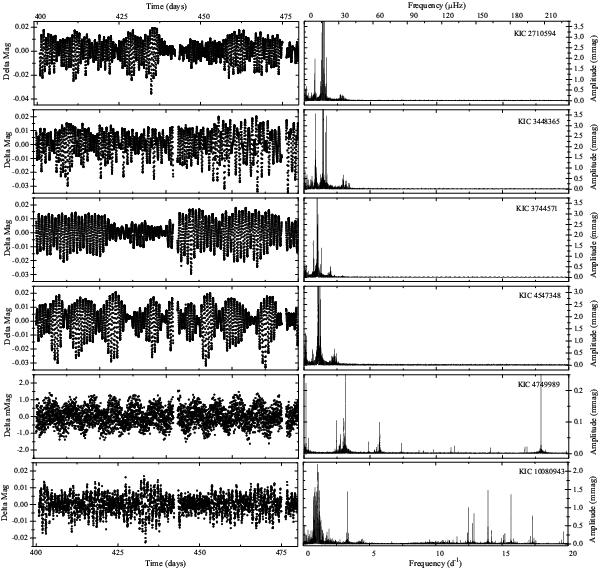
Light curves (left) and amplitude spectra (right) of selected stars. From top to bottom: KIC 02710594, 03448365, 03744571, 04547348, 04749989, and 10080943. The y-scale of the left panel represents differential magnitude after subtraction of the corresponding mean value for each target. Note a mmag scale for KIC 04749989.
This figure is made of several images, please see below:
Current usage metrics show cumulative count of Article Views (full-text article views including HTML views, PDF and ePub downloads, according to the available data) and Abstracts Views on Vision4Press platform.
Data correspond to usage on the plateform after 2015. The current usage metrics is available 48-96 hours after online publication and is updated daily on week days.
Initial download of the metrics may take a while.