Fig. 15
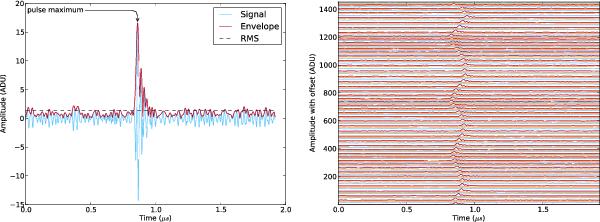
Illustrative results of the CR pipeline. Left: CR pulse as recorded by one LBA antenna along with the reconstructed Hilbert envelope. The square of the Hilbert envelope corresponds to the sum of the squares of the original signal and the squares of the Hilbert transform. The Hilbert envelope is the amplitude of the analytic signal and essentially captures the amplitude of the pulse. Right: Hilbert envelopes for all antennas of one station ordered by their RCU number. One can clearly see the time delay of the air shower signal between different antennas as the antennas are numbered in a circular layout (Nelles et al. 2013).
Current usage metrics show cumulative count of Article Views (full-text article views including HTML views, PDF and ePub downloads, according to the available data) and Abstracts Views on Vision4Press platform.
Data correspond to usage on the plateform after 2015. The current usage metrics is available 48-96 hours after online publication and is updated daily on week days.
Initial download of the metrics may take a while.