Free Access
Fig. A.1
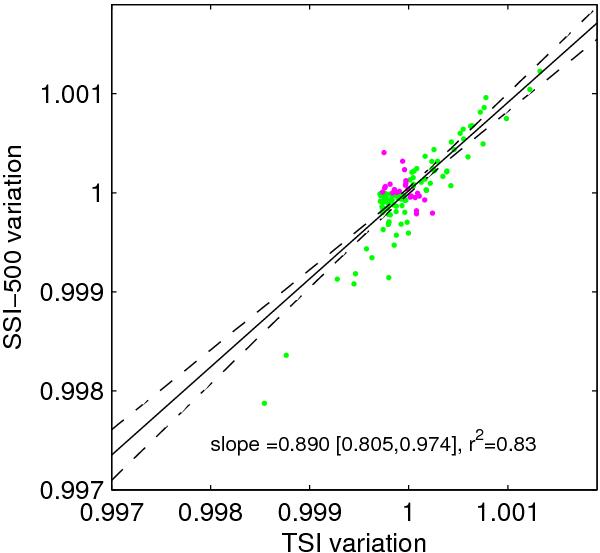
SSI variation at 500 nm versus TSI variation for the period from 2001 to 2012 with robust linear regression. Green dots (n = 104) have positive correlation; magenta dots (m = 21) are anti-correlated with TSI.
Current usage metrics show cumulative count of Article Views (full-text article views including HTML views, PDF and ePub downloads, according to the available data) and Abstracts Views on Vision4Press platform.
Data correspond to usage on the plateform after 2015. The current usage metrics is available 48-96 hours after online publication and is updated daily on week days.
Initial download of the metrics may take a while.