Free Access
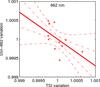
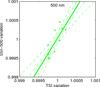
Fig. 4
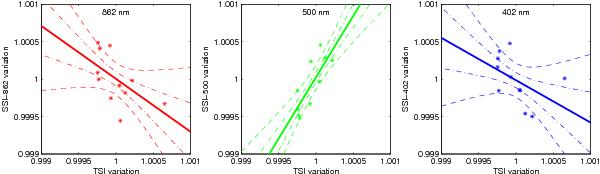
VIRGO SSI (RGB) versus TSI variations based on annual means from 2002 to 2012. Solid lines indicate the robust linear regressions, the dash dot and dashed lines are, respectively, 1σ and 2σ uncertainties.
This figure is made of several images, please see below:
Current usage metrics show cumulative count of Article Views (full-text article views including HTML views, PDF and ePub downloads, according to the available data) and Abstracts Views on Vision4Press platform.
Data correspond to usage on the plateform after 2015. The current usage metrics is available 48-96 hours after online publication and is updated daily on week days.
Initial download of the metrics may take a while.