Fig. 8
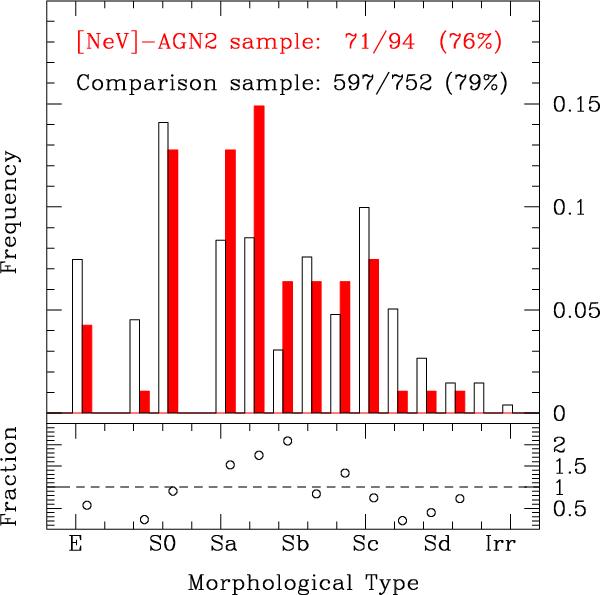
Morphology distribution of the 71 classified type 2 AGN hosts (red filled histogram) compared with that of the 597 normal galaxies belonging to the control (8 ×) mass-matched sample (black empty histogram). In the bottom panel, the fraction between the relative frequencies of the two populations is plotted as a function of the Hubble types.
Current usage metrics show cumulative count of Article Views (full-text article views including HTML views, PDF and ePub downloads, according to the available data) and Abstracts Views on Vision4Press platform.
Data correspond to usage on the plateform after 2015. The current usage metrics is available 48-96 hours after online publication and is updated daily on week days.
Initial download of the metrics may take a while.