Free Access
Fig. 4
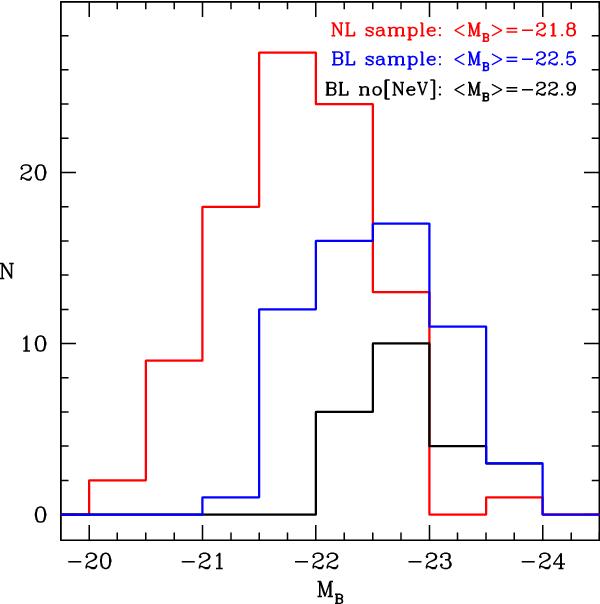
Absolute B-magnitude distributions: the red histogram represents the sample of 94 type 2 AGN, the blue histogram the sample of 60 type 1 AGN, and the black histogram the subsample of 23 BL-AGN with undetected [Ne v]. The median absolute B-magnitudes of the three samples are also indicated.
Current usage metrics show cumulative count of Article Views (full-text article views including HTML views, PDF and ePub downloads, according to the available data) and Abstracts Views on Vision4Press platform.
Data correspond to usage on the plateform after 2015. The current usage metrics is available 48-96 hours after online publication and is updated daily on week days.
Initial download of the metrics may take a while.