Free Access
Fig. 2
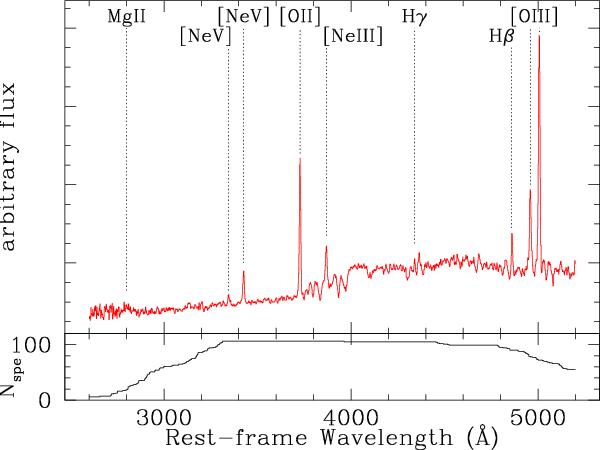
Composite spectrum of the type 2 AGN sample with identification of the main emission lines. The flux is given per unit wavelength (Fλ) and the normalization is arbitrary. The number of single spectra contributing to the composite is shown in the bottom panel as a function of the rest-frame wavelength.
Current usage metrics show cumulative count of Article Views (full-text article views including HTML views, PDF and ePub downloads, according to the available data) and Abstracts Views on Vision4Press platform.
Data correspond to usage on the plateform after 2015. The current usage metrics is available 48-96 hours after online publication and is updated daily on week days.
Initial download of the metrics may take a while.