Fig. 11
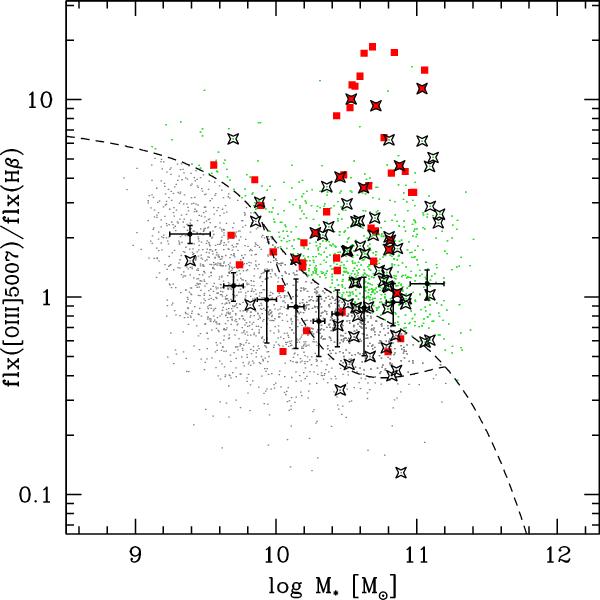
Mass-Excitation (MEx) diagram in the redshift range 0.65 < z < 0.92. The dashed lines show the empirical curves defined by Juneau et al. (2011), dividing the plane into an upper region, occupied by galaxies hosting an AGN, and a lower region where the star-forming galaxies are located. Objects located between the two curves are classified as AGN/SF composite galaxies. The small points represent the same sample of 2461 zCOSMOS galaxies used in Fig. 10. Large red squares correspond to [Ne v]-selected objects, while the X-ray emitting galaxies are identified by large starred symbols. The filled dots with error bars represent the line-flux ratios measured in nine composite spectra of galaxies that were not included in the diagram because of their low S/N emission lines. The horizontal error bars indicate the dispersion of the stellar mass values in each of the bin, whereas the vertical error bars show the estimated error on the flux ratios.
Current usage metrics show cumulative count of Article Views (full-text article views including HTML views, PDF and ePub downloads, according to the available data) and Abstracts Views on Vision4Press platform.
Data correspond to usage on the plateform after 2015. The current usage metrics is available 48-96 hours after online publication and is updated daily on week days.
Initial download of the metrics may take a while.