Fig. 10
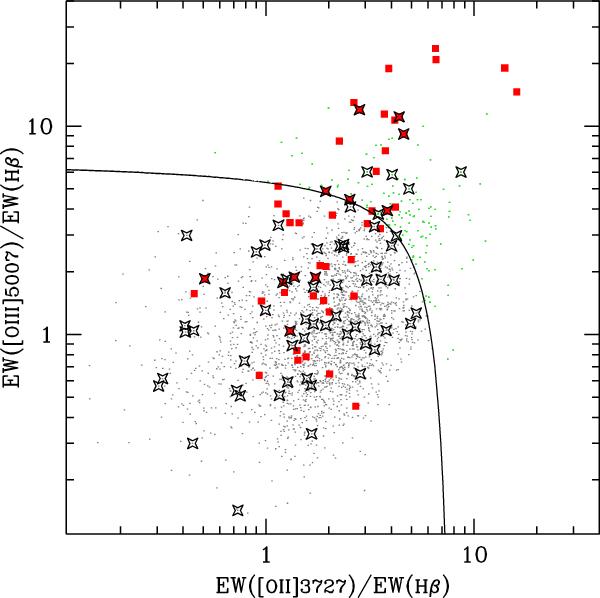
Blue diagnostic diagram in the interval 0.65 < z < 0.92. The solid line shows the demarcation between SFG and type 2 AGN defined by Lamareille (2010). Small points represent the 2461 zCOSMOS galaxies for which all emission lines are detected with an S/N > 3. Large red squares correspond to [Ne v]-selected objects, while the X-ray emitting galaxies are identified by large starred symbols.
Current usage metrics show cumulative count of Article Views (full-text article views including HTML views, PDF and ePub downloads, according to the available data) and Abstracts Views on Vision4Press platform.
Data correspond to usage on the plateform after 2015. The current usage metrics is available 48-96 hours after online publication and is updated daily on week days.
Initial download of the metrics may take a while.