Fig. 3
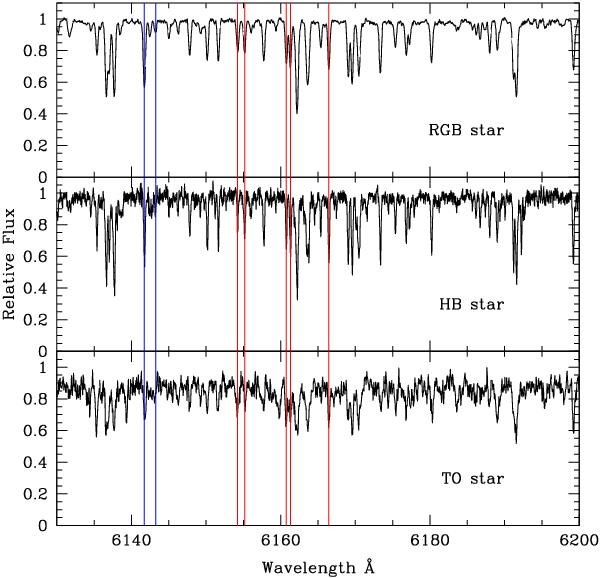
Section of three of our target spectra: M151, NGC 5927-05, and T021. The spectra are arranged in order of increasing S/N. Two blue lines (to the left) indicate the location of the Ba ii and Zr i lines at 614.17 nm and 614.31 nm, respectively. The five red lines indicate the position of the Si i line at 615.51 nm, the Na i lines at 615.42 nm and 616.07 nm, and the Ca i lines at 616.13 nm, and 616.64 nm, respectively.
Current usage metrics show cumulative count of Article Views (full-text article views including HTML views, PDF and ePub downloads, according to the available data) and Abstracts Views on Vision4Press platform.
Data correspond to usage on the plateform after 2015. The current usage metrics is available 48-96 hours after online publication and is updated daily on week days.
Initial download of the metrics may take a while.