Free Access
Fig. 7
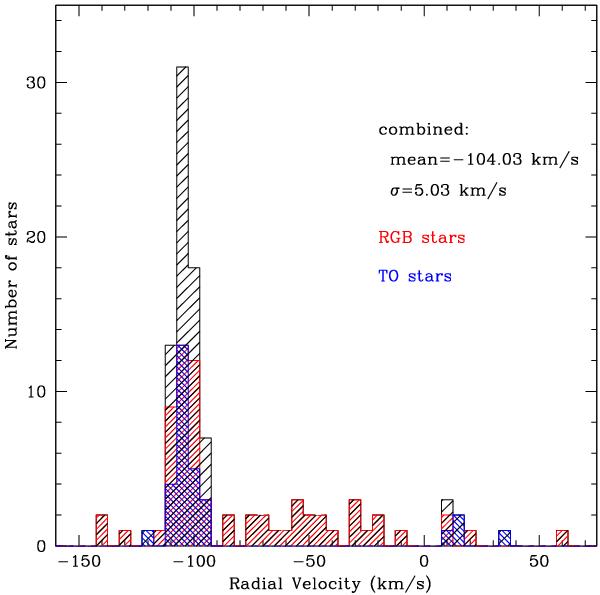
Distribution of measured heliocentric radial velocities for our target stars. Radial velocity variables are excluded. The black histogram is the combined sample. The red and blue histograms are the RGB-GIRAFFE and TO samples, respectively.
Current usage metrics show cumulative count of Article Views (full-text article views including HTML views, PDF and ePub downloads, according to the available data) and Abstracts Views on Vision4Press platform.
Data correspond to usage on the plateform after 2015. The current usage metrics is available 48-96 hours after online publication and is updated daily on week days.
Initial download of the metrics may take a while.