Fig. 4
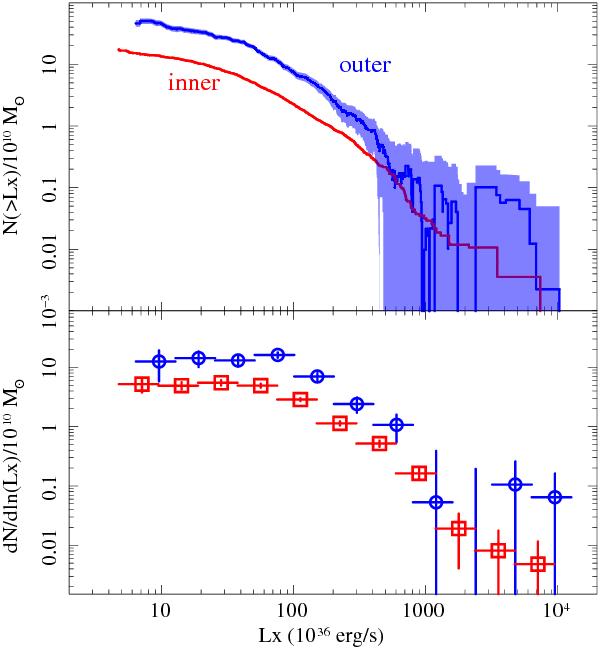
XLFs of LMXBs in the inner and the outer regions in cumulative (upper panel) and differential (lower panel) forms. The data for the outer regions is marked by circles in the lower panel and is surrounded by the shaded area showing the 1σ Poissonian uncertainty in the upper panel. The statistical uncertainties for the inner region have smaller amplitude.
Current usage metrics show cumulative count of Article Views (full-text article views including HTML views, PDF and ePub downloads, according to the available data) and Abstracts Views on Vision4Press platform.
Data correspond to usage on the plateform after 2015. The current usage metrics is available 48-96 hours after online publication and is updated daily on week days.
Initial download of the metrics may take a while.