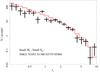
Fig. 2
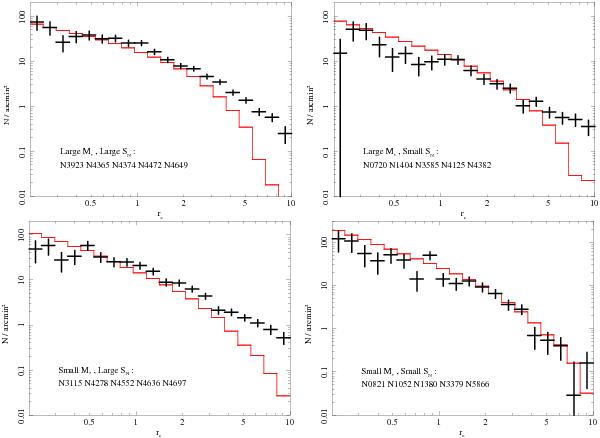
Stacked radial source density profiles of the CXB subtracted LMXBs in four groups of galaxies with different M⋆ and SN, marked in the plots. The profiles are not corrected for incompleteness. The predicted distributions of LMXBs based on the KS-band light are plotted with solid histograms. They take into account the source detection incompleteness, as described in Sect. 3.1. All groups show excess LMXBs in their outskirts, except for galaxies with small M⋆ and small SN.
Current usage metrics show cumulative count of Article Views (full-text article views including HTML views, PDF and ePub downloads, according to the available data) and Abstracts Views on Vision4Press platform.
Data correspond to usage on the plateform after 2015. The current usage metrics is available 48-96 hours after online publication and is updated daily on week days.
Initial download of the metrics may take a while.