Fig. 7
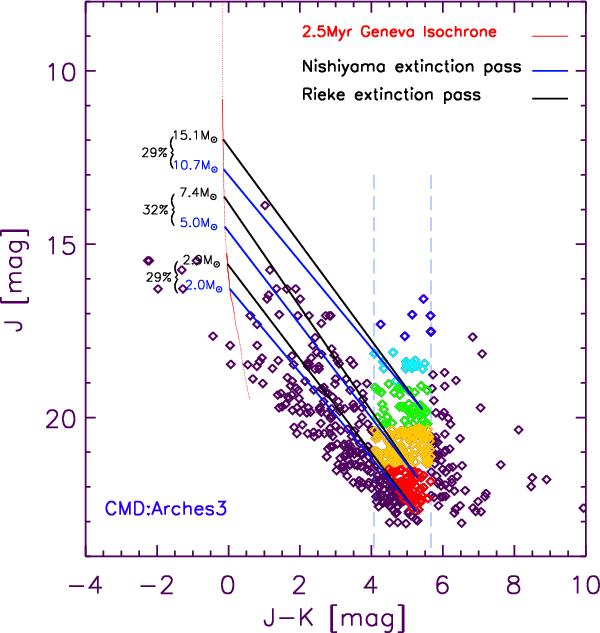
Color–magnitude diagram of Field 3 in the outskirts of the Arches cluster. Cluster members are selected between the two dashed lines and are color coded according to their J-band magnitude. A Geneva isochrone of solar metallicity with an age of 2.5 Myr is also shown. Black lines represent the extinction path assuming the Rieke & Lebofsky (1985) extinction law, while blue lines are extinction paths based on the Nishiyama et al. (2009) extinction law. The difference in derived masses using the two laws are written for sample sources close to the isochrone in percentage.
Current usage metrics show cumulative count of Article Views (full-text article views including HTML views, PDF and ePub downloads, according to the available data) and Abstracts Views on Vision4Press platform.
Data correspond to usage on the plateform after 2015. The current usage metrics is available 48-96 hours after online publication and is updated daily on week days.
Initial download of the metrics may take a while.