Fig. 6
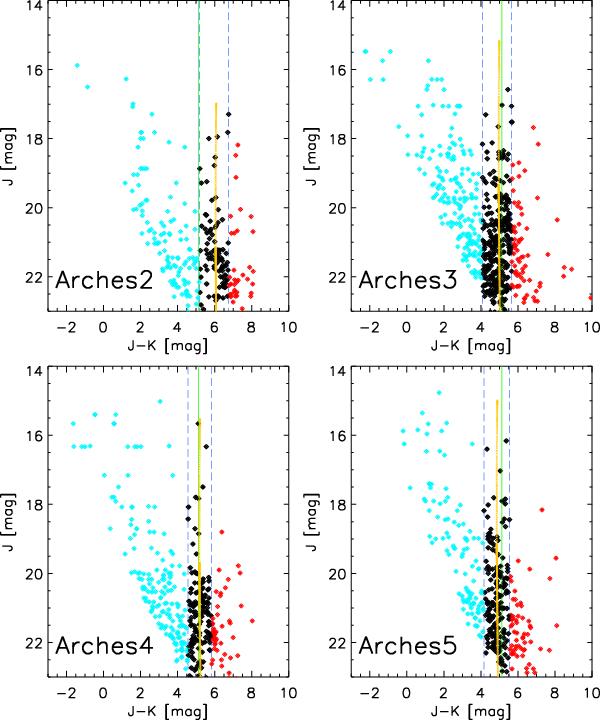
Color–magnitude diagrams of the outskirts of the Arches cluster. Blue dashed lines show the color selection used to choose the cluster members and discard background (blue diamonds) and foreground (red diamonds) sources. The Geneva isochrone with the mean extinction value of the cluster members in each field is shown in yellow. The green dot-dashed line represents the approximate mean color of the cluster members in the center of the cluster where the mean extinction is slightly lower.
Current usage metrics show cumulative count of Article Views (full-text article views including HTML views, PDF and ePub downloads, according to the available data) and Abstracts Views on Vision4Press platform.
Data correspond to usage on the plateform after 2015. The current usage metrics is available 48-96 hours after online publication and is updated daily on week days.
Initial download of the metrics may take a while.