Fig. 13
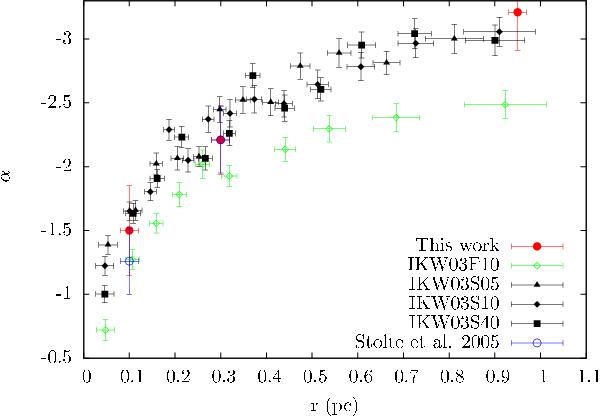
Figure adopted from Harfst et al. (2010) in their Fig. 13, and compares the mass function slopes from the best-fitting models of N-body simulations of the Arches cluster to the observed values of this work and also from Stolte et al. (2005). The black filled symbols represent the models with a Salpeter IMF with different lower mass limits, while green open symbols correspond to a model with a flat IMF. The models deviate primarily at larger radii (r > 0.4 pc). The derived slope from a model starting with a Salpeter IMF at birth in the radius of 1 pc is α ~ − 3, which is in good agreement with our finding of αNishi ~ − 3.21 ± 0.30 in the outskirts of the Arches cluster.
Current usage metrics show cumulative count of Article Views (full-text article views including HTML views, PDF and ePub downloads, according to the available data) and Abstracts Views on Vision4Press platform.
Data correspond to usage on the plateform after 2015. The current usage metrics is available 48-96 hours after online publication and is updated daily on week days.
Initial download of the metrics may take a while.