Fig. 11
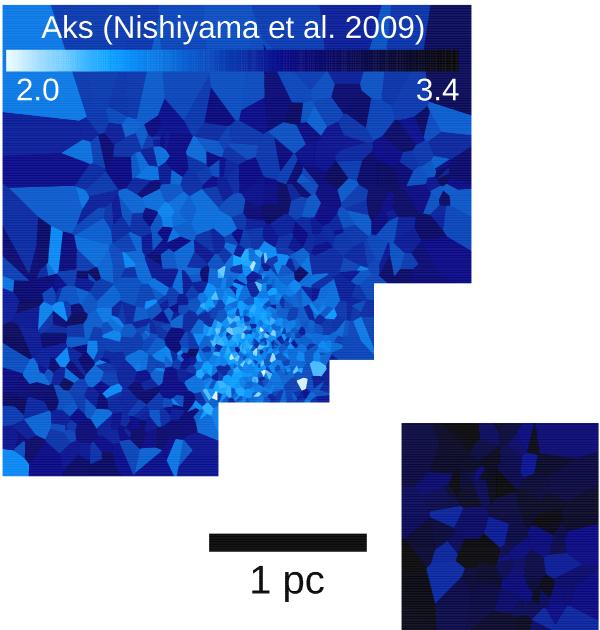
Extinction map of the Arches cluster using Voronoi diagrams. Each star is associated with one and only one cell, the color of which is determined by the measured extinction value at the location of the star. A region of lower extinction is present in the center of the cluster, while stripes of higher extinction are present in the southwest and partly northwest of the cluster. The extinction is high and varies by up to ~2 mag across the cluster. The extinction values derived based on the Nishiyama et al. (2009) extinction law vary between 2 < AKs < 3.4 mag, while utilizing the Rieke & Lebofsky (1985) extinction law yields an extinction range of 2.7 < AKs < 4.5 mag (not shown). The structure of the two extinction maps based on the two different extinction laws is only marginally different. North is up and east to the left.
Current usage metrics show cumulative count of Article Views (full-text article views including HTML views, PDF and ePub downloads, according to the available data) and Abstracts Views on Vision4Press platform.
Data correspond to usage on the plateform after 2015. The current usage metrics is available 48-96 hours after online publication and is updated daily on week days.
Initial download of the metrics may take a while.