Fig. 9
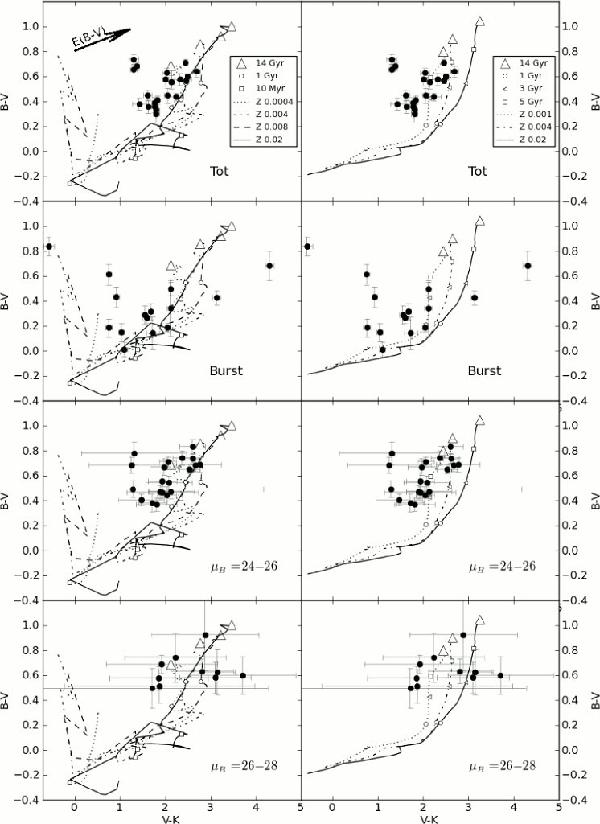
Integrated optical/NIR colors with SEM tracks with (left panel) and without (right panel) nebular emission. From top to bottom in both panels the plotted data points are the total colors over the entire area of the galaxy, the estimated burst colors down to μB = 24, the colors of the μB ~ 24 − 26 halo region, and the colors of the μB ~ 26 − 28 halo region. The data are corrected for Galactic extinction. The errorbars include different uncertainties depending on the case (see Sect. 3.3), and the burst uncertainties may be underestimated. The number of targets in the plots is not equal since the burst/host separation fails completely for a number of objects with irregular morphology, or the integrated flux inside μB ~ 26 − 28 is negative for the K band. The left panel shows Yggdrasil tracks with nebular emission, with metallicities Z = 0.0004 (dotted), Z = 0.004 (dash-dotted), Z = 0.008 (dashed), and Z = 0.02 (line). The ages of 10 Myr (open square), 1 Gyr (open circle), and 14 Gyr (open triangle) are marked for convenience. In the right panel the tracks are for a pure stellar population with a Salpeter IMF, Mmin = 0.08 M⊙, Mmax = 120 M⊙, an e-folding time of 109 yr, and with metallicity Z = 0.001 (dotted), Z = 0.004 (dash-dotted), and Z = 0.02 (line). The ages of 1 (open circle), 3 (open left triangle), 5 (open square), and 14 Gyr (open triangle) are marked for convenience.
Current usage metrics show cumulative count of Article Views (full-text article views including HTML views, PDF and ePub downloads, according to the available data) and Abstracts Views on Vision4Press platform.
Data correspond to usage on the plateform after 2015. The current usage metrics is available 48-96 hours after online publication and is updated daily on week days.
Initial download of the metrics may take a while.