Fig. 6
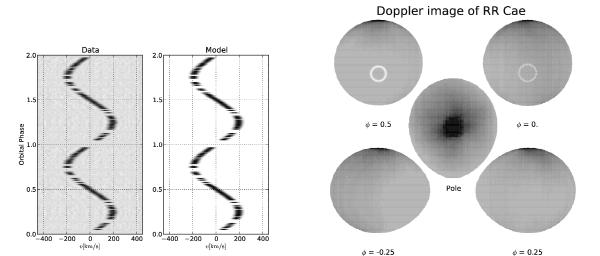
Left: LSD and modeled trailed spectrogram of the absorption features from the M-dwarf of RR Cae. The profiles are repeated in phase for better visualization. Right: Doppler imaging reconstruction of the surface brightness distribution of the M-dwarf at four binary phases (corner maps) and as seen from the pole of the star (center map). The corresponding binary phase is indicated below each map. A solid and dotted circle is overlaid around the point in the stellar surface that is crossed by the binary axis. The solid line represents the inner face of the star, i.e., the one facing the WD. Here dark colors represent regions with lower specific intensity, and therefore, cooler or spotted regions.
Current usage metrics show cumulative count of Article Views (full-text article views including HTML views, PDF and ePub downloads, according to the available data) and Abstracts Views on Vision4Press platform.
Data correspond to usage on the plateform after 2015. The current usage metrics is available 48-96 hours after online publication and is updated daily on week days.
Initial download of the metrics may take a while.