Fig. 4
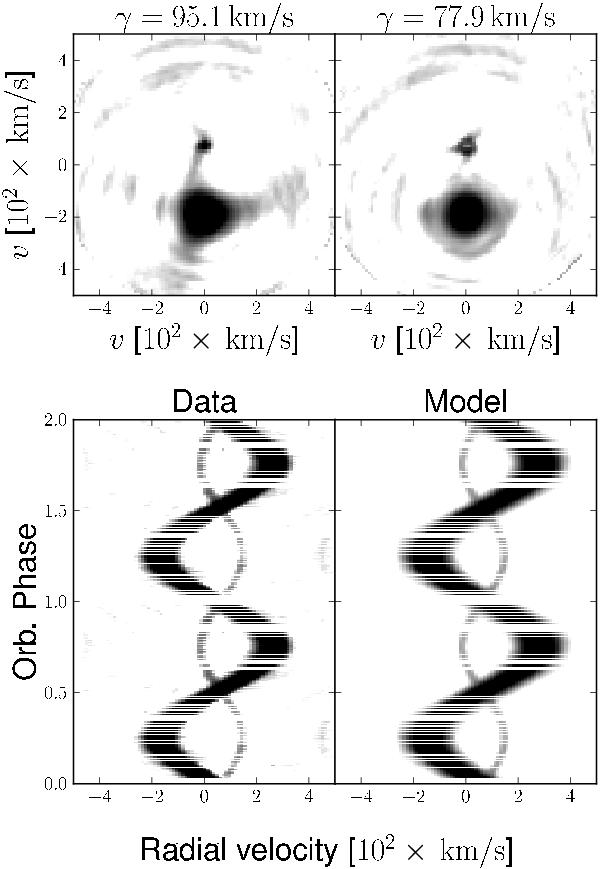
Doppler tomography of the Hα emission line. The Doppler tomograms are shown in the top left and right panels, obtained considering the solution for the γ-velocity of the extra component of the line (probably generated by the WD) and for the M-dwarf component, respectively. In the bottom panel we show a trailed spectrum of the data (left) and the resulting model based on the map with the γ-velocity of the additional component. See text for a more detailed explanation.
Current usage metrics show cumulative count of Article Views (full-text article views including HTML views, PDF and ePub downloads, according to the available data) and Abstracts Views on Vision4Press platform.
Data correspond to usage on the plateform after 2015. The current usage metrics is available 48-96 hours after online publication and is updated daily on week days.
Initial download of the metrics may take a while.