Fig. 3
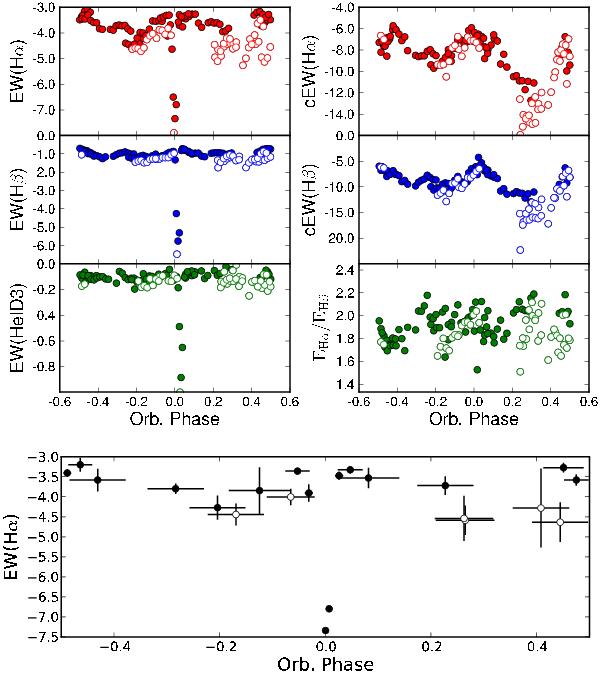
Phase-folded equivalent width of selected chromospheric emission lines and EHα/EHβ ratio from the M-dwarf component of RR Cae. Here we adopted the convention that emission lines have negative EWs, so the lower the value, the stronger the line with respect to the continuum. Upper two-column plots: full time-resolution data. In the left panels we show the EWs of the Hα, Hβ, and He iD3 emission lines. Open symbols represent epochs with overlapping phases where the average value of the EW of the Hα line differs by more than the mutual standard deviation. In the left panels we show the EW measured directly from the spectrum. In the right, the middle and top panels shows the same measurements corrected for the contribution of the WD. In the lower right panel we show the corresponding EHα/EHβ ratio. See text for discussion. Bottom single plot: the mean EW for each cycle of the Hα line. The error bars represent the range (highest and lowest values) of each measurement.
Current usage metrics show cumulative count of Article Views (full-text article views including HTML views, PDF and ePub downloads, according to the available data) and Abstracts Views on Vision4Press platform.
Data correspond to usage on the plateform after 2015. The current usage metrics is available 48-96 hours after online publication and is updated daily on week days.
Initial download of the metrics may take a while.