Fig. 1
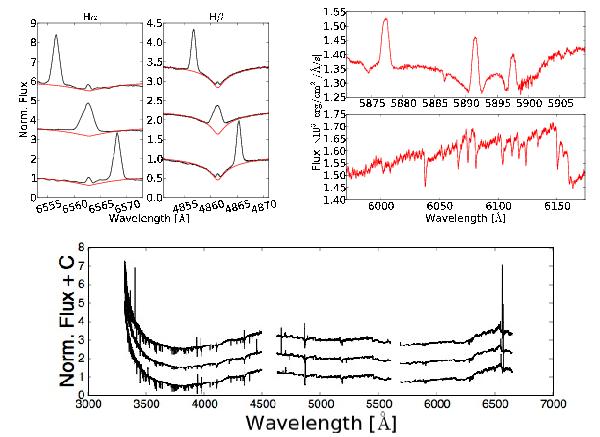
Sample spectroscopic regions of the optical spectra of RR Cae. The left two panels show a combinations of all spectra around quadratures (phases [0.2:0.3] and [0.7:0.8], top and bottom, respectively) and superior conjunction (phases [0.45:0.55], middle spectra) around Hα and Hβ. The spectra where rectified by the radial velocity of the WD so that the center of the broad Balmer absorption matches the rest wavelength of the line. A red line represents the WD model spectrum scaled to the appropriate relative contribution of the star and is vertically shifted to match the continuum level (see text for discussion). The spectra at each phase are also shifted in the y direction for better visualization. At the right-hand side we show a combination of spectra of the M-dwarf component alone (taken during the eclipse of the WD), around the Na i doublet (D1 = 5896 Å and D2 = 5890 Å) and He i (5876 Å) region, and in a region with abundant photospheric metal lines from the M dwarf, at the top and bottom panels, respectively.An average of all spectra around quadratures and superior conjunction is shown at the bottom panel. Each spectrum is divided by the mean of the spectrum between 4575 Å and 5540 Å and is vertically shifted for better visualization.
Current usage metrics show cumulative count of Article Views (full-text article views including HTML views, PDF and ePub downloads, according to the available data) and Abstracts Views on Vision4Press platform.
Data correspond to usage on the plateform after 2015. The current usage metrics is available 48-96 hours after online publication and is updated daily on week days.
Initial download of the metrics may take a while.