Fig. 6
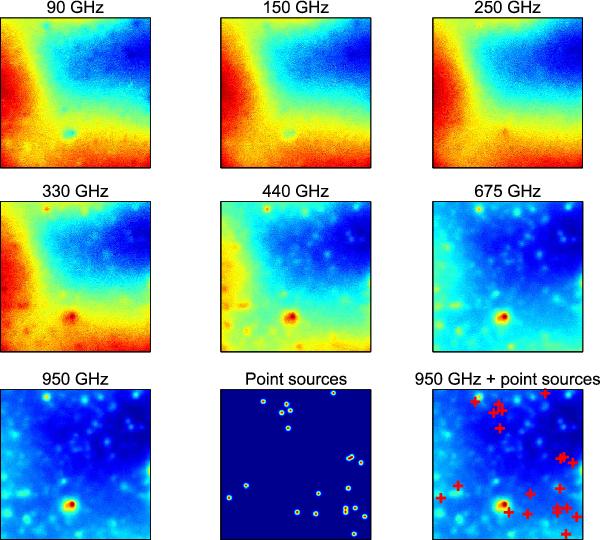
Simulations of a sky region at high Galactic declination at the ALMA observing frequencies, with 20 randomly distributed point sources with the same intensity added. In this case the point sources have a spectrum given by curve a2 in Fig. 3. The PSFs are assumed to be Gaussian with a standard deviation of 3 pixels. Noise is Gaussian-white with standard deviation set to 0.12 times the standard deviation of the values in the corresponding noise-free maps. The PSFs are assumed to be Gaussian with a standard deviation of 3 pixels. The two bottom-right panels show the simulated point sources and their position on the 950 GHz map.
Current usage metrics show cumulative count of Article Views (full-text article views including HTML views, PDF and ePub downloads, according to the available data) and Abstracts Views on Vision4Press platform.
Data correspond to usage on the plateform after 2015. The current usage metrics is available 48-96 hours after online publication and is updated daily on week days.
Initial download of the metrics may take a while.