Fig. 3
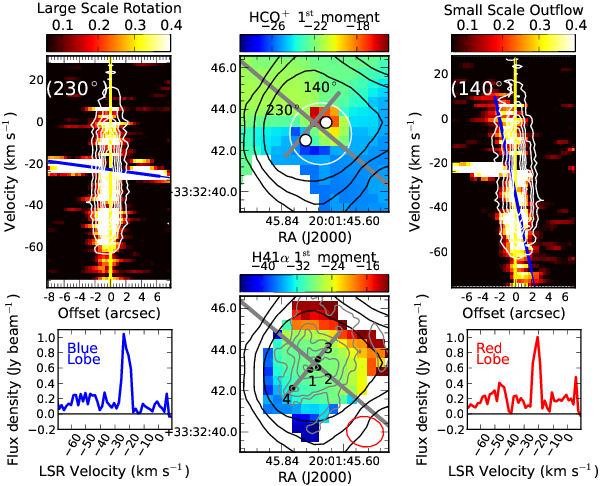
First Moment Maps: the middle two panels show the first moment maps of the HCO+ (top) and H41α (bottom) emission towards the center of K3-50A. with their spreads in velocities noted at the top of each panel. The two gray lines show the cuts used for the two PV diagrams shown to the left and right. The labeled black dots in the H41α map show the positions of the four IR sources in Okamoto et al. (2003) which are likely high mass protostars. The black contours show the 90 GHz continuum emission as in panels b and c of Fig. 1, while the gray contours show the 23 GHz continuum (at 10, 30, 100 and 300σ). The red circle at the bottom right shows the synthesized CARMA beam. The white dots on the HCO+ map show the positions used for the two spectra displayed here. PV Diagrams: the two PV diagrams show the ionized (contours) and molecular (colorscale) emission along the outflow direction (at a position angle of 140°) as well as the emission perpendicular to it (at a position angle of 230°). The yellow line in each panel shows the source center, and it is clear that there is a velocity gradient in the high velocity dispersion gas at 140°. The large scale rotation at a position of 230° manifests in the low velocity dispersion emission. These velocity gradients are highlighted with blue lines.
Current usage metrics show cumulative count of Article Views (full-text article views including HTML views, PDF and ePub downloads, according to the available data) and Abstracts Views on Vision4Press platform.
Data correspond to usage on the plateform after 2015. The current usage metrics is available 48-96 hours after online publication and is updated daily on week days.
Initial download of the metrics may take a while.