Free Access
Fig. 9
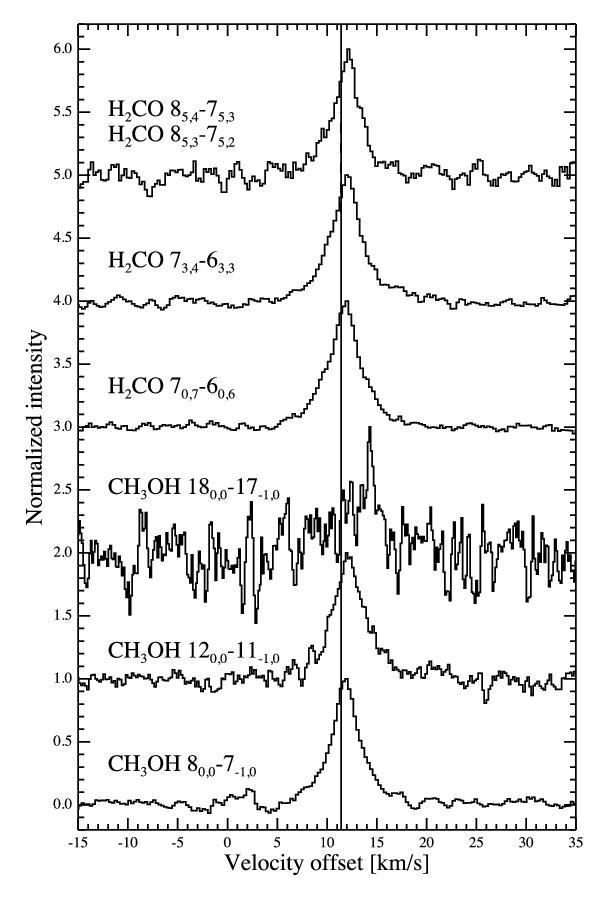
Normalized line profiles of some CH3OH and H2CO lines, representing, from bottom to top, upper level energies Eu ≈ 100 K, 200 K and 400 K for both species. The solid vertical line marks the source velocity of 11.4 km s-1.
Current usage metrics show cumulative count of Article Views (full-text article views including HTML views, PDF and ePub downloads, according to the available data) and Abstracts Views on Vision4Press platform.
Data correspond to usage on the plateform after 2015. The current usage metrics is available 48-96 hours after online publication and is updated daily on week days.
Initial download of the metrics may take a while.