Free Access
Fig. 6
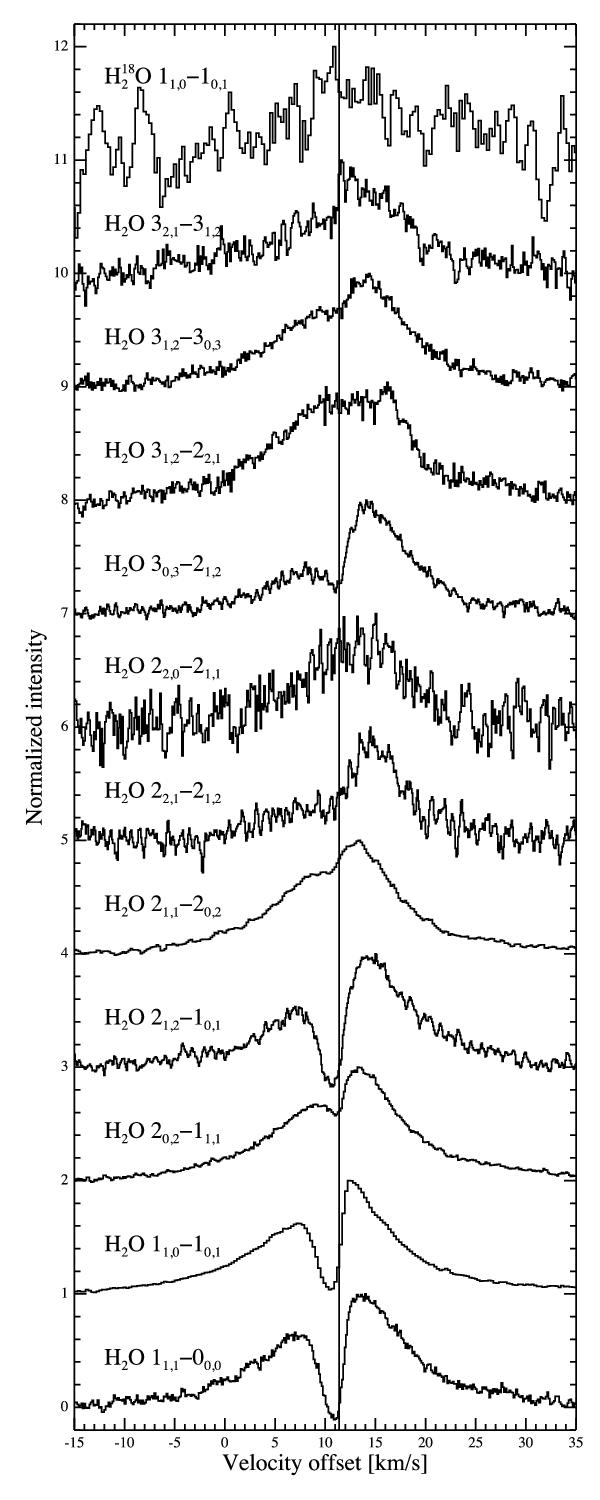
Normalized profiles of the H2O lines detected in the survey, displayed with a vertical offset of 1 between each profile. The solid vertical line marks the source velocity of 11.4 km s-1. The narrow dips are dominated by self-absorption.
Current usage metrics show cumulative count of Article Views (full-text article views including HTML views, PDF and ePub downloads, according to the available data) and Abstracts Views on Vision4Press platform.
Data correspond to usage on the plateform after 2015. The current usage metrics is available 48-96 hours after online publication and is updated daily on week days.
Initial download of the metrics may take a while.