Fig. 4
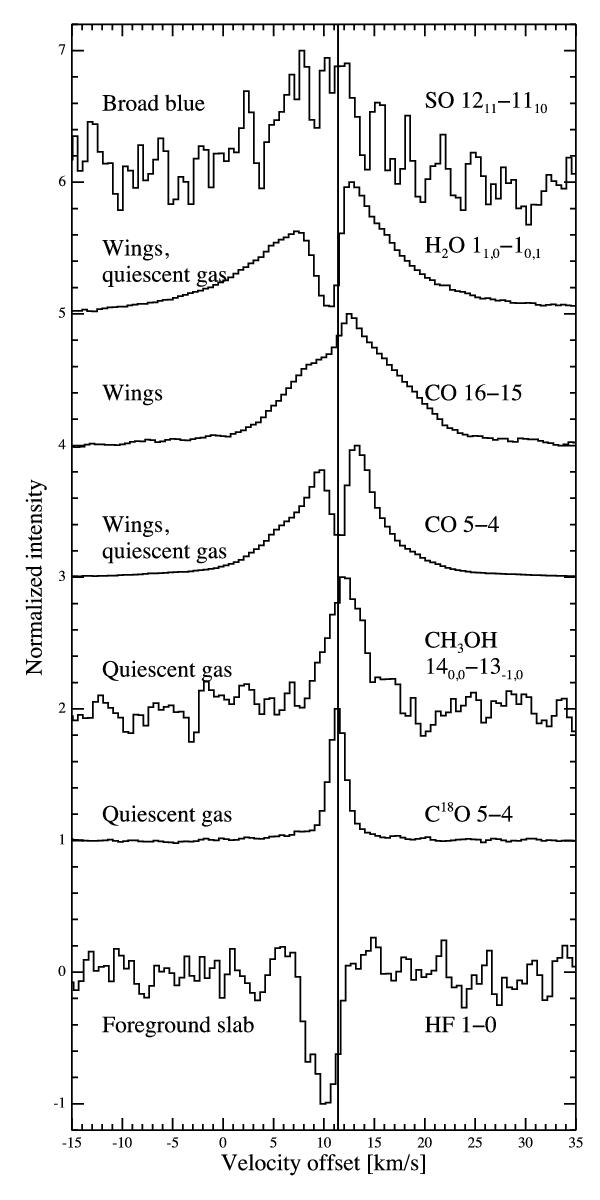
Main components of the line profiles. The solid vertical line shows the source velocity, 11.4 km s-1. The two velocity regimes of quiescent gas are illustrated by C18O and CH3OH. The deep, narrow absorption feature in CO is due to emission in the reference beams, while the absorption in H2O appears to be source-related. The broad blue component is represented by SO. The HF line traces foreground material in the foreground slab, at 9 km s-1, with another contribution from the quiescent gas.
Current usage metrics show cumulative count of Article Views (full-text article views including HTML views, PDF and ePub downloads, according to the available data) and Abstracts Views on Vision4Press platform.
Data correspond to usage on the plateform after 2015. The current usage metrics is available 48-96 hours after online publication and is updated daily on week days.
Initial download of the metrics may take a while.