Fig. 3
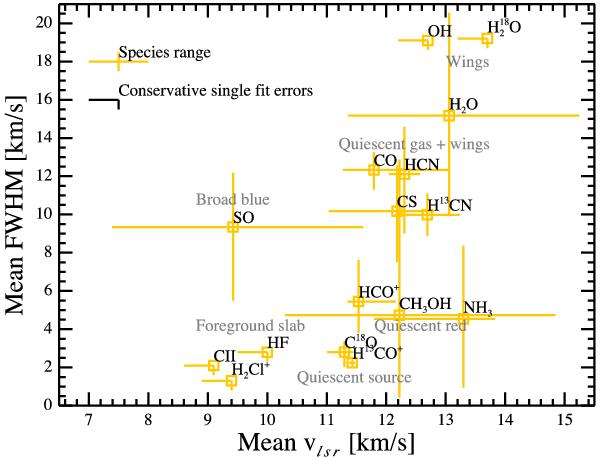
Mean velocities and linewidths from Gaussian fits to lines of representative species. Several groups emerge, these are labeled in gray and referred to in the text. The orange bars give the range of fit parameters of the full set of lines of each species. The black bars, at top left, show the conservative Gaussian parameter fit uncertainties (see also Sect. 3.2). Where the orange bars are one-sided, showing the conservative fit errors, only a single line was detected or simultaneous fitting of multiple lines forced the species to appear at a single vlsr. For a discussion, see Sect. 4.1.
Current usage metrics show cumulative count of Article Views (full-text article views including HTML views, PDF and ePub downloads, according to the available data) and Abstracts Views on Vision4Press platform.
Data correspond to usage on the plateform after 2015. The current usage metrics is available 48-96 hours after online publication and is updated daily on week days.
Initial download of the metrics may take a while.