Fig. 2
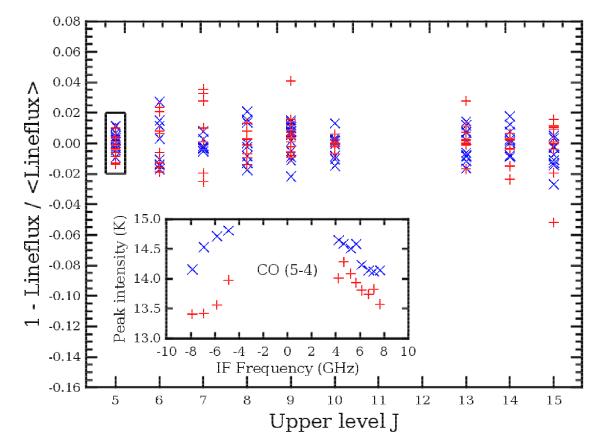
Fractional difference of the double-sideband CO line fluxes from their mean for each rotational line. The H polarization is shown in blue (x) and V in red (+). The inset shows the peak line intensity of the CO (5–4) transition, highlighted in the main plot with a box, versus intermediate frequency (IF) position. Negative IF frequency denotes lower side band (LSB).
Current usage metrics show cumulative count of Article Views (full-text article views including HTML views, PDF and ePub downloads, according to the available data) and Abstracts Views on Vision4Press platform.
Data correspond to usage on the plateform after 2015. The current usage metrics is available 48-96 hours after online publication and is updated daily on week days.
Initial download of the metrics may take a while.