Free Access
Fig. 13
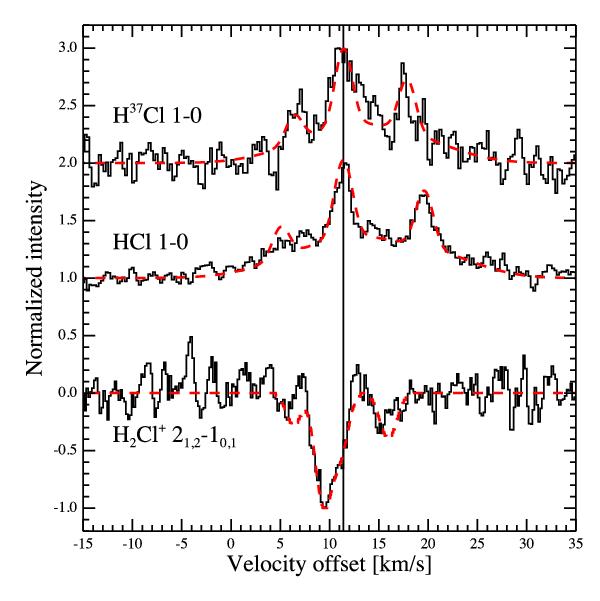
Normalized line profiles of the main detected HCl and H2Cl+ transitions. The solid vertical line marks the source velocity of 11.4 km s-1. The CASSIS models for each species, used to obtain the vlsr and width of the lines, are shown with red dashed lines.
Current usage metrics show cumulative count of Article Views (full-text article views including HTML views, PDF and ePub downloads, according to the available data) and Abstracts Views on Vision4Press platform.
Data correspond to usage on the plateform after 2015. The current usage metrics is available 48-96 hours after online publication and is updated daily on week days.
Initial download of the metrics may take a while.