Fig. 1
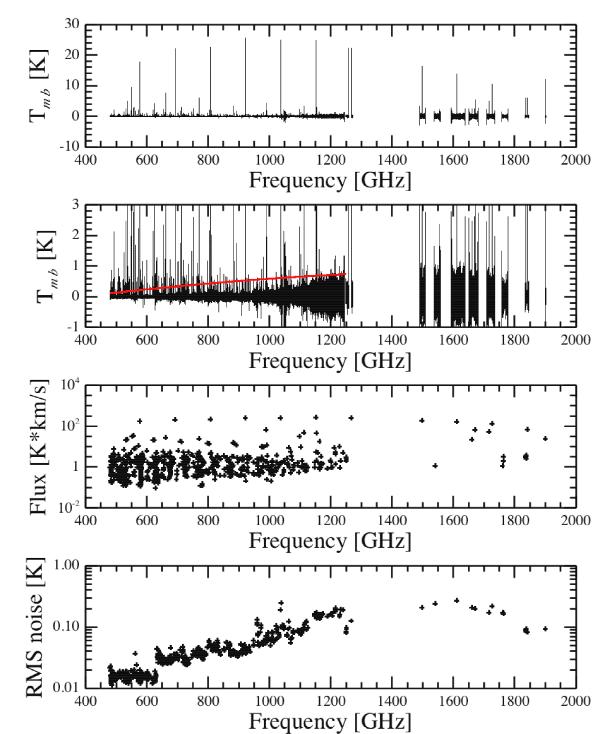
Upper panel: full baseline-subtracted spectral survey (black line) at 1.1 MHz resolution. The set of bright lines towering above the rest is CO, the feature at 1901 GHz is CII. Second panel: full baseline-subtracted spectral survey (black line) on a blown-up y-scale to emphasize weak lines and a second-order polynomial fit (red) to the subtracted continuum in bands 1a through 5a (red). Third panel: Tmb scale integrated intensity of each detected transition. Lower panel: the local rms noise around each detected transition.
Current usage metrics show cumulative count of Article Views (full-text article views including HTML views, PDF and ePub downloads, according to the available data) and Abstracts Views on Vision4Press platform.
Data correspond to usage on the plateform after 2015. The current usage metrics is available 48-96 hours after online publication and is updated daily on week days.
Initial download of the metrics may take a while.