Fig. A.1
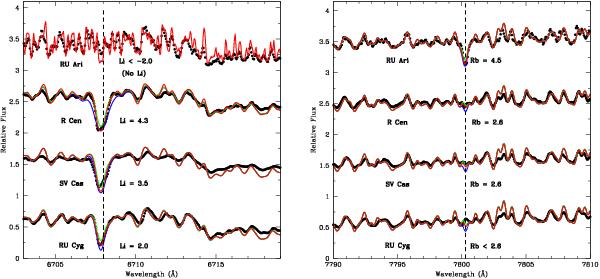
High-resolution optical spectra (in black) and best model fits (in red) in the Li I 6708 Å region (left panel) and Rb I 7800 Å region (right panel) for the AGB stars RU Ari, R Cen, SV Cas, and RU Cyg. The derived Li and Rb abundances (in the usual scale log N(X) + 12) are indicated. Synthetic spectra obtained for Li and Rb abundances shifted +0.5 dex (in blue) and −0.5 dex (in green) (these values are ±1.0 for Li in R Cen and SV Cas) from the adopted values are also shown. We note that Li is not detected in the extreme OH/IR AGB star RU Ari, which displays a strong Rb I line that is not detected in the other stars.
Current usage metrics show cumulative count of Article Views (full-text article views including HTML views, PDF and ePub downloads, according to the available data) and Abstracts Views on Vision4Press platform.
Data correspond to usage on the plateform after 2015. The current usage metrics is available 48-96 hours after online publication and is updated daily on week days.
Initial download of the metrics may take a while.