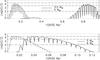
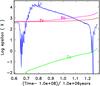
Fig. 1

Left panel: HBB-FST predictions of the Li abundance versus time from the beginning of the AGB (in Myr). The horizontal lines represent the observed values of logε(Li) = 2.0, 3.5, and 4.3. Right panel: HBB-MLT Li, Rb, Zr, and Tc predictions for a 5 M⊙ model with a delayed superwind. We note that the Tc abundance is an upper limit because the trend of the half-life of 99Tc − decreasing with temperature from terrestrial 0.22 Myr to ~3 yr at the peak temperature of ~350 MK − is not included in the model (though we do not expect large differences, see Mathews et al. 1986).
Current usage metrics show cumulative count of Article Views (full-text article views including HTML views, PDF and ePub downloads, according to the available data) and Abstracts Views on Vision4Press platform.
Data correspond to usage on the plateform after 2015. The current usage metrics is available 48-96 hours after online publication and is updated daily on week days.
Initial download of the metrics may take a while.