Free Access
Fig. 1
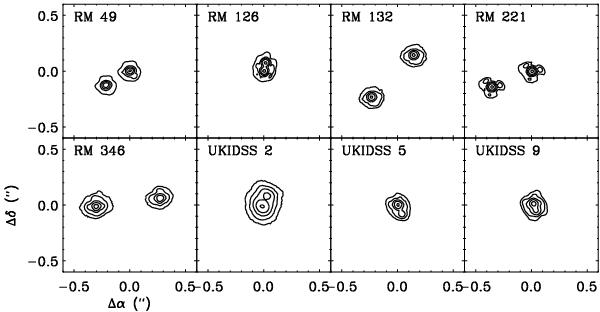
Contour plots of all subarcsecond binaries detected in this survey. All images were taken with the K filter, except for UKIDSS 2, which was observed with the K′ filter. In each panel, the highest contour is placed at factors 2− n (0 ≤ n ≤ 5) times 90% of the peak pixel.
Current usage metrics show cumulative count of Article Views (full-text article views including HTML views, PDF and ePub downloads, according to the available data) and Abstracts Views on Vision4Press platform.
Data correspond to usage on the plateform after 2015. The current usage metrics is available 48-96 hours after online publication and is updated daily on week days.
Initial download of the metrics may take a while.