Fig. 6
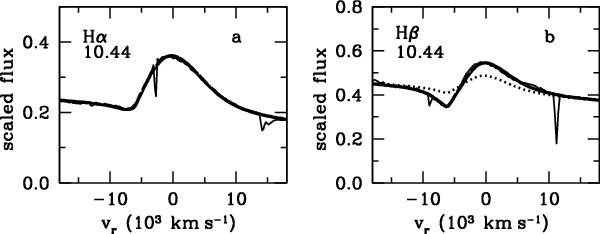
The best-fit simulations of the Hα and Hβ lines (thick lines) are overplotted on the corresponding profiles observed on day 11 (thin lines). Unlike the calculations shown in Fig. 5, here we use a simple model with the radial distributions of the Sobolev optical depth and the line emissivity, which are similar for the Hα and Hβ lines, but scaled arbitrarily to fit both profiles. The dotted line represents the Hβ line for the theoretical ratio Rτ = 7.25.
Current usage metrics show cumulative count of Article Views (full-text article views including HTML views, PDF and ePub downloads, according to the available data) and Abstracts Views on Vision4Press platform.
Data correspond to usage on the plateform after 2015. The current usage metrics is available 48-96 hours after online publication and is updated daily on week days.
Initial download of the metrics may take a while.