Fig. 3
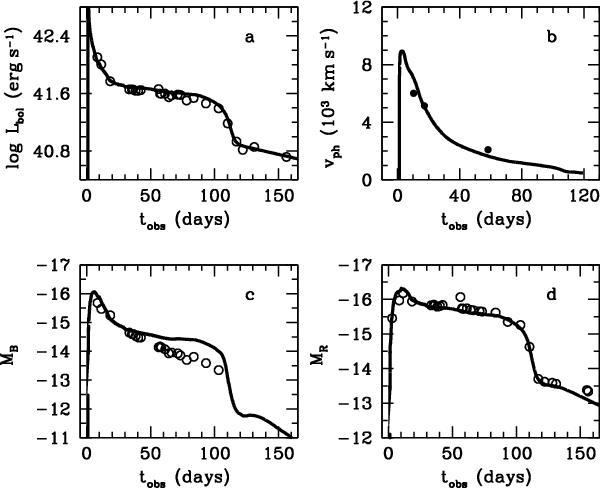
Optimal hydrodynamic model. Panel a) the bolometric light curve of the optimal model (solid line) overplotted on the bolometric data of SN 2008in (open circles) evaluated from the UBVRIJH magnitudes reported by Roy et al. (2011). Panel b) the calculated photospheric velocity (solid line) is compared to the photospheric velocity estimated from the Hα, Hβ, He I 5876 Å, and Na I doublet profiles in the spectra presented by Roy et al. (filled circles). Panels c) and d) the calculated B and R light curves (solid line) compared to the observations of SN 2008in (open circles) obtained by Roy et al.
Current usage metrics show cumulative count of Article Views (full-text article views including HTML views, PDF and ePub downloads, according to the available data) and Abstracts Views on Vision4Press platform.
Data correspond to usage on the plateform after 2015. The current usage metrics is available 48-96 hours after online publication and is updated daily on week days.
Initial download of the metrics may take a while.