Fig. 4
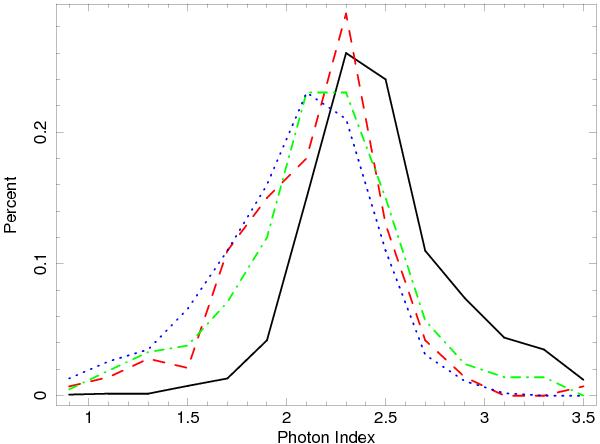
Distribution of the photon indexes as measured by using the one-day light curve over four years of activity (black continuum line), and the GTI-bin light curves for the outbursts A (red dashed line), B (green dot-dashed line), and C (blue dotted line). It is evident that the distributions during the three outbursts are harder.
Current usage metrics show cumulative count of Article Views (full-text article views including HTML views, PDF and ePub downloads, according to the available data) and Abstracts Views on Vision4Press platform.
Data correspond to usage on the plateform after 2015. The current usage metrics is available 48-96 hours after online publication and is updated daily on week days.
Initial download of the metrics may take a while.