Fig. 1
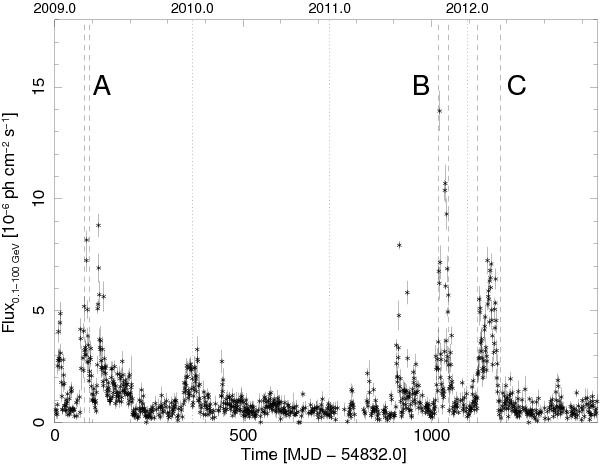
Global light curve of PKS 1510−089 in the 0.1 < E < 100 GeV energy band with 1-day time bin. Time starts on 2009 January 1 (MJD 54 832.0). Vertical dotted lines indicated the 1 January of each year. Vertical dashed lines delimit the period of the three outbursts analyzed here. Outburst A: 2009 March; outburst B: 2011 October/November; outburst C: 2012 February/March.
Current usage metrics show cumulative count of Article Views (full-text article views including HTML views, PDF and ePub downloads, according to the available data) and Abstracts Views on Vision4Press platform.
Data correspond to usage on the plateform after 2015. The current usage metrics is available 48-96 hours after online publication and is updated daily on week days.
Initial download of the metrics may take a while.