Fig. 3
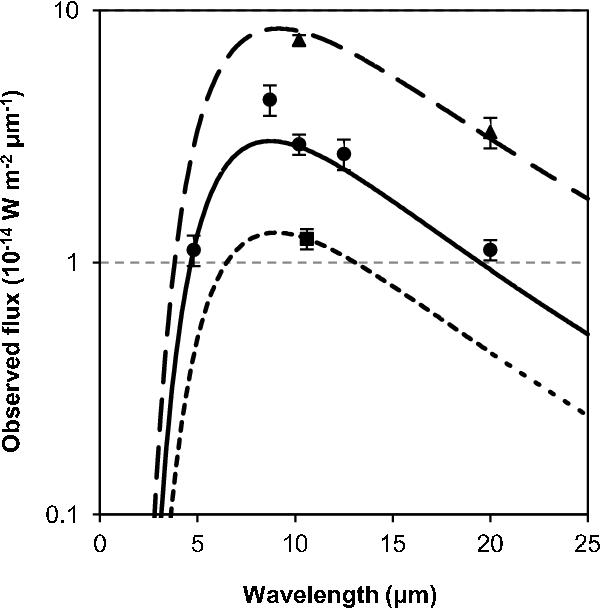
Example ATPM fit to the (1862) Apollo thermal-infrared observations using the “new” shape model variant, a thermal inertia of 140 J m-2 K-1 s−1/2, and a roughness fraction of 60%. Thermal-infrared observations obtained on the 17th November, 26th November, and 4th December 1980 are depicted by the solid triangles, circles, and square (Lebofsky et al. 1981), and their model fits are represented by the dashed, solid, and dotted lines respectively. The model thermal-infrared spectra are shown at a single rotation phase corresponding to when the ~10 μm observation was conducted for each observation set. However, the observations were made at different rotation phases within each observation set and therefore have been adjusted to a single rotation phase for direct visual comparison with the model. To adjust the observations, the ratios of the model fluxes from their respective rotation phases to the ~10 μm observation rotation phase was calculated and then applied to each flux measurement. This then allows direct visual comparison of the model thermal-infrared spectrum and the observations at a single rotation phase. However, for ATPM chi-square fitting, the observed fluxes were compared to the model fluxes at their respective observation rotation phases.
Current usage metrics show cumulative count of Article Views (full-text article views including HTML views, PDF and ePub downloads, according to the available data) and Abstracts Views on Vision4Press platform.
Data correspond to usage on the plateform after 2015. The current usage metrics is available 48-96 hours after online publication and is updated daily on week days.
Initial download of the metrics may take a while.