Fig. 8
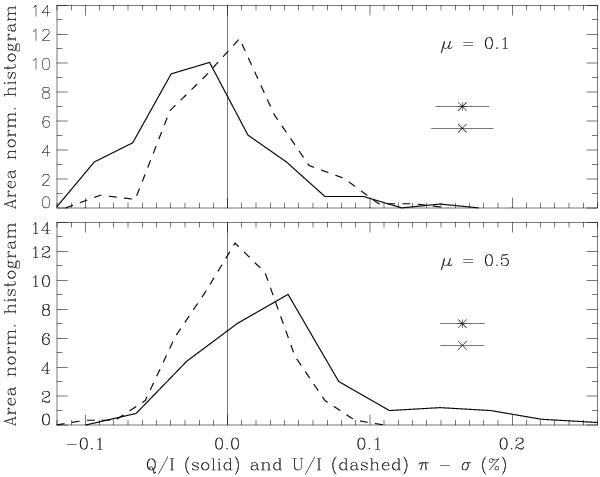
Histograms of Q/I (solid) and U/I (dashed) for the 5250.22 Å line, which are sampled along the spectrograph slit for the two Stokes spectra illustrated in Figs. 4 and 5. The measured quantity is the difference between the π component and the average of the two σ components. The error bars for a single pixel are indicated (with asterisk representing Q/I, cross U/I). While the U/I distributions are symmetric around zero, the Q/I distributions are skewed in favor of horizontal fields in the upper panel and in favor of vertical fields in the bottom panel.
Current usage metrics show cumulative count of Article Views (full-text article views including HTML views, PDF and ePub downloads, according to the available data) and Abstracts Views on Vision4Press platform.
Data correspond to usage on the plateform after 2015. The current usage metrics is available 48-96 hours after online publication and is updated daily on week days.
Initial download of the metrics may take a while.