Fig. 7
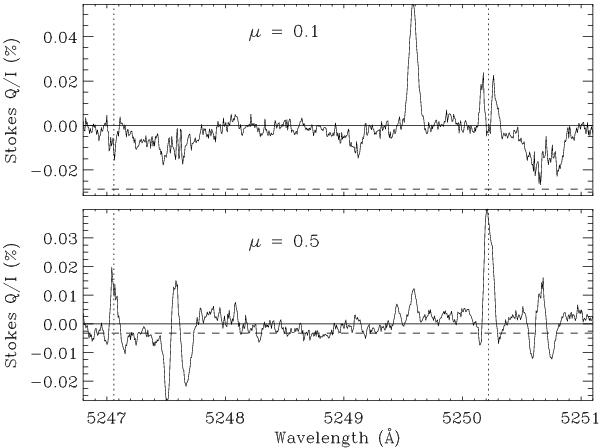
Slit averages of the 2D Q/I spectra in Figs. 4 and 5. The zero point of the polarization scale, which should lie at the level of the dashed line, has been shifted to represent the continuum level, since the amplitudes of the Zeeman effect are measured relative to the continuum. The dotted vertical lines mark the line centers of the 5247.06 and 5250.22 Å lines. The reversal of the sign of the transverse Zeeman effect from μ = 0.1 to μ = 0.5 shows that the angular distribution changes from predominantly horizontal to vertical as we move away from the limb.
Current usage metrics show cumulative count of Article Views (full-text article views including HTML views, PDF and ePub downloads, according to the available data) and Abstracts Views on Vision4Press platform.
Data correspond to usage on the plateform after 2015. The current usage metrics is available 48-96 hours after online publication and is updated daily on week days.
Initial download of the metrics may take a while.