Free Access
Fig. 2
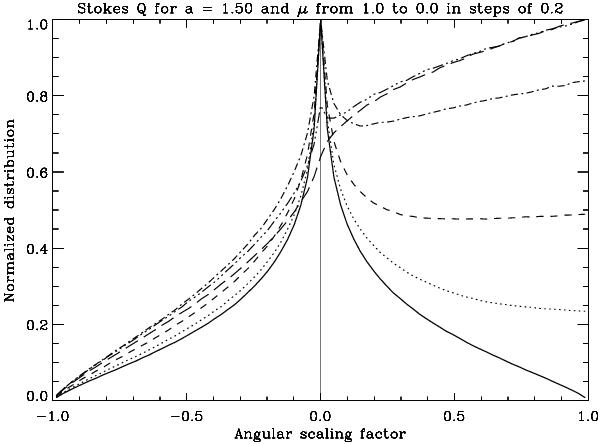
Distribution of the angular scaling factor gQ for a = 1.5 and a sequence of μ values, decreasing from the disk-center value 1.0 (the symmetric solid line) to the extreme limb value of 0.0 in steps of 0.2. As μ decreases, the curves in the right-hand part of the diagram become increasingly elevated.
Current usage metrics show cumulative count of Article Views (full-text article views including HTML views, PDF and ePub downloads, according to the available data) and Abstracts Views on Vision4Press platform.
Data correspond to usage on the plateform after 2015. The current usage metrics is available 48-96 hours after online publication and is updated daily on week days.
Initial download of the metrics may take a while.