Fig. 8
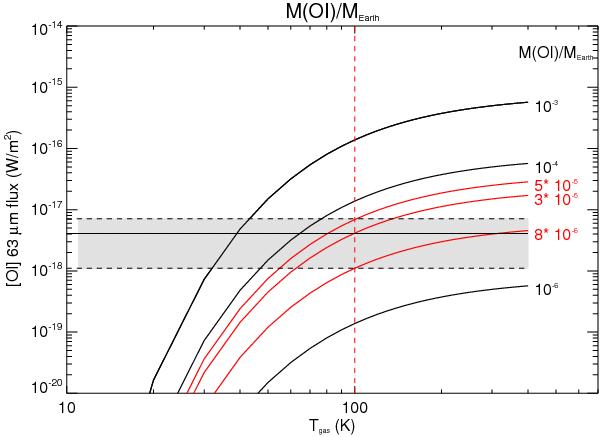
Line luminosity versus gas excitation temperature for TWA 04B. The black and red curves represent the behaviour for different gas masses. The red ones show masses compatible with the observed flux range in TWA 04B for Tgas = 100 K. The grey dashed region shows the flux density values consistent with our observations.
Current usage metrics show cumulative count of Article Views (full-text article views including HTML views, PDF and ePub downloads, according to the available data) and Abstracts Views on Vision4Press platform.
Data correspond to usage on the plateform after 2015. The current usage metrics is available 48-96 hours after online publication and is updated daily on week days.
Initial download of the metrics may take a while.