Free Access
Fig. 7
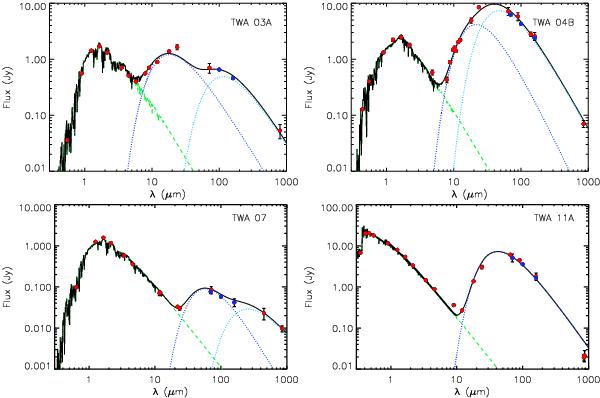
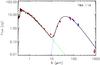
Blackbody models for TWA members. Dark and light blue dashed lines depict the different blackbody components for the two blackbodies model. The blue dots represent PACS observations at 70, 100 and 160 μm. The green line represents the photospheric contribution.
This figure is made of several images, please see below:
Current usage metrics show cumulative count of Article Views (full-text article views including HTML views, PDF and ePub downloads, according to the available data) and Abstracts Views on Vision4Press platform.
Data correspond to usage on the plateform after 2015. The current usage metrics is available 48-96 hours after online publication and is updated daily on week days.
Initial download of the metrics may take a while.