Fig. 6
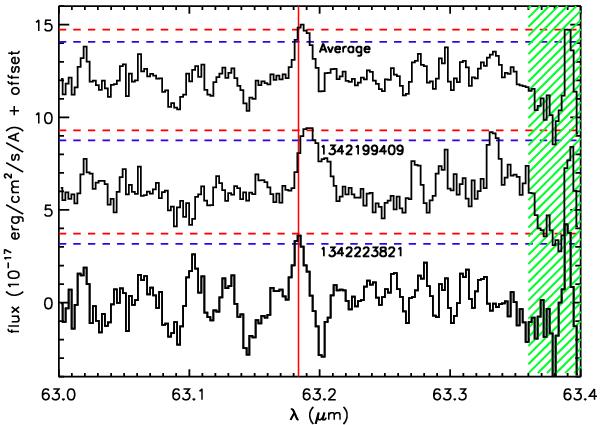
The three different continuum subtracted spectra in the region around 63 μm for TWA 04B. An arbitrary vertical shift was applied to the spectra for easy comparison. The vertical red line shows the rest wavelength of the [OI] 63.18 μm emission line. The green dashed area shows the position of a region where the noise dominates the emission. The red dashed horizontal lines show the the 3σ limit for the three spectra. The blue dashed horizontal lines show the 3σ limit when points inside the green dashed area are excluded.
Current usage metrics show cumulative count of Article Views (full-text article views including HTML views, PDF and ePub downloads, according to the available data) and Abstracts Views on Vision4Press platform.
Data correspond to usage on the plateform after 2015. The current usage metrics is available 48-96 hours after online publication and is updated daily on week days.
Initial download of the metrics may take a while.