Fig. 5
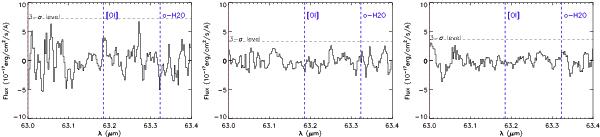
Continuum subtracted spectra of TWA members showing IR excess but no line emission at 63 μm. The vertical blue dashed lines represent the position of the [OI] and o-H2O. From left to right, targets are: TWA 03A, TWA 07 and TWA 11A. We show 3σ limits as horizontal, black dashed lines.
Current usage metrics show cumulative count of Article Views (full-text article views including HTML views, PDF and ePub downloads, according to the available data) and Abstracts Views on Vision4Press platform.
Data correspond to usage on the plateform after 2015. The current usage metrics is available 48-96 hours after online publication and is updated daily on week days.
Initial download of the metrics may take a while.