Fig. 2
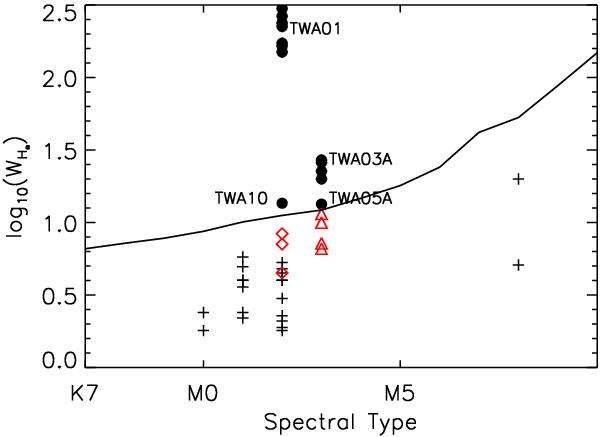
Accretion in TWA members. Plus symbols depict objects with Hα in agreement with pure chromospheric emission, while black dots are objects with Hα in agreement with ongoing accretion. TWA 05A and TWA 10 show variable emission with some epochs over the chromospheric level and some epochs below the chromospheric level. Red diamonds and red triangles represent Hα equivalent widths below the chromospheric level for TWA 10 and TWA 05A, respectively. The solid line shows the saturation criterion by Barrado y Navascués & Martín (2003).
Current usage metrics show cumulative count of Article Views (full-text article views including HTML views, PDF and ePub downloads, according to the available data) and Abstracts Views on Vision4Press platform.
Data correspond to usage on the plateform after 2015. The current usage metrics is available 48-96 hours after online publication and is updated daily on week days.
Initial download of the metrics may take a while.