Free Access
Fig. 1
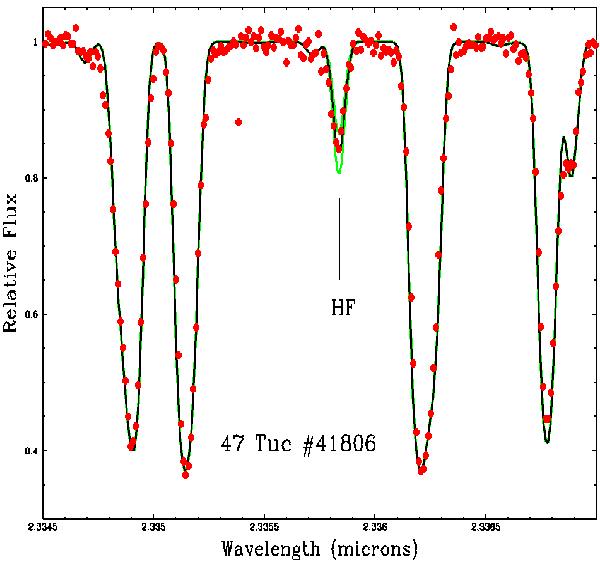
Observed (filled red circles) and synthetic spectra (continuous lines) around the HF(1-0) R9 line for the star 47 Tuc #41806. The best fit (black line) corresponds to the fluorine abundance reported in Table 1 and synthetic spectra computed with ±0.1 dex changes in the F-abundance are superimposed (green lines).
Current usage metrics show cumulative count of Article Views (full-text article views including HTML views, PDF and ePub downloads, according to the available data) and Abstracts Views on Vision4Press platform.
Data correspond to usage on the plateform after 2015. The current usage metrics is available 48-96 hours after online publication and is updated daily on week days.
Initial download of the metrics may take a while.